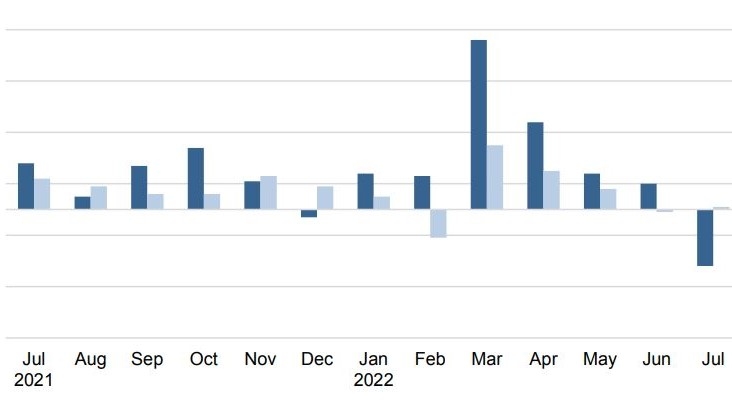
 Chart from Singstat.
Chart of the day: Export price index slips by 2.2% in July
It reversed the 1% gain in June.
This chart from the Department of Statistics shows the month-on-month (MoM) change in the Export Price Index as well as the non-oil index.

The chart shows that the export price index fell by 2.2%, completely reversing the gain it had in June.
The oil index dropped 8.1%, in contrast to the 3.7% gain in the previous month. The non-oil index increased 0.1% in July 2022, compared to the 0.1% decline in June 2022.
Amongst the non-oil sub-indices, increases were led by the Machinery & Transport Equipment (0.6%) and the Miscellaneous Manufactured Articles (0.3%) indices.
ALSO READ: Import price index slips 4.5% MoM in June
The increases were partly offset by decreases in the Manufacture Goods (3.4%) index, due primarily to lower prices of non-ferrous metals, and the Chemicals & Chemical Products (0.7%) index.


 Advertise


