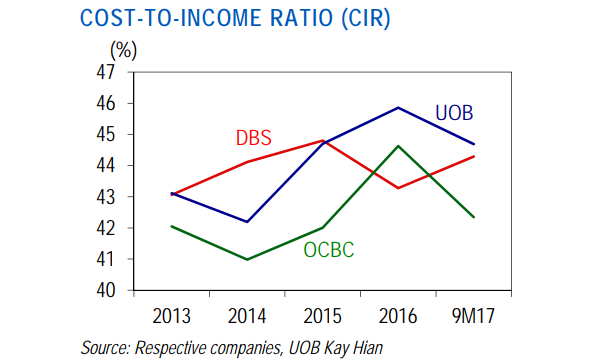
Chart of the Day: OCBC has the leanest cost structure amongst banks in 2017
Its cost-to-income ratio of 42.3% is lower than those of its peers.
This chart from UOB Kay Hian shows OCBC had a lean cost structure compared to DBS and OCBC as it had the lowest cost-to-income ratio (CIR) of 42.3% in the first nine months of 2017.
It has the lowest staff cost per employee at $83,333. Other non-wage expenses accounted for 38.4% of total operating expenses. It managed to maintain CIR at 42% in 2015 despite the initial drag from OCBC Wing Hang, which had a higher CIR of 48.4%.
Meanwhile, DBS had a CIR of 44.3% in first nine months of 2017, up from 43.3% last year. Total income grew 6.4% YoY, faster than 1.5% YoY growth for expenses.
For UOB, expenses also grew faster than income in 2015 and 2016, resulting in deterioration in CIR from 45.9% in 2016 to 44.7% in 9M2017. Growth in income picked up to 8.5% YoY in 9M2017, but its expense growth of 6.7% was still faster than peers.


 Advertise


