Chart of the Day: Check out which markets drove tourist spending through the roof in Q1
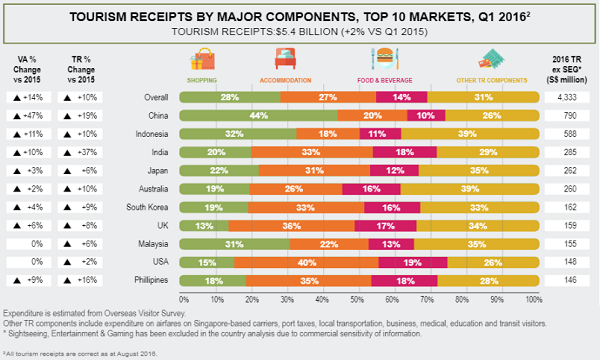
China generated $790m in expenditure.
Singapore's tourism kicked off with a bang in 2016, as both visitor arrivals and tourist spending skyrocketed in Q1.
According to the Singapore Tourism Board, stripping out expenditure on Sightseeing, Entertainment & Gaming (SEG), China, Indonesia and India were the top three tourism receipt (TR) generating markets in Q1, contributing 38% of tourism receipts. This spells spending of $790m, $588m, and $285m respectively.
The top 10 is rounded out by Japan ($262m), Australia ($260m), South Korea ($162m), UK ($159m), Malaysia ($155m), USA ($148m), and the Philippines ($146m).
Among the top 10 TR markets, China, India, and Indonesia's YoY growth in TR were the highest. Respectively, this constitutes spikes of 19%, 37%, and 10%.
In terms of shopping, China had the highest YoY growth with 44%. For accommodation, USA topped growth with 40% YoY. Food & Beverage TR growth was also dominated by USA with a 19% YoY expansion. For other TR Components, Indonesia led the pack with a 39% YoY jump.


 Advertise


