Chart of the Day: See how the hospitality industry weakened over the past 12 years
Negative changes in revenue per available room at started in 2013.
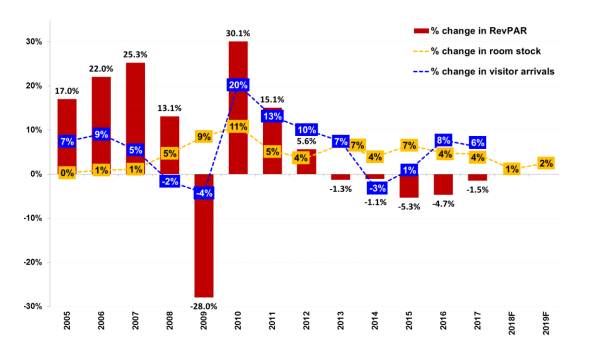
This chart from OCBC Investment Research shows how the hospitality industry fared in the past 12 years according to supply, visitor arrivals, and revenue per average room (RevPAR).
Compared to previous years, the industry is currently in a lull. RevPARs are expected to improve in 2018 with better supply-demand dynamics, though weak RevPAR growth is still expected in Q1 2018 given the back-end loaded supply injection in 2017.
However, the sector's conditions could be improving. The 1.5% decline in Singapore hotels’ revenue per available room (RevPAR) in 2017 is softer compared to 4.7% and 5.3% dips for the whole of 2016 and 2015, respectively.
Growth for hotels was highest in 2010, which marked the openings of Singapore’s two integrated resorts (IR) as well as the hosting of the Youth Olympic Games. Before that, 2009 saw the most negative RevPAR growth of -28% as it was the year after the Credit Crisis.
RevPAR growth was steady in 2005 to 2007, but the change in visitor arrivals dipped from 7% to 5% as Asia approached the Credit Crisis.
Another notable year was 2014, the year of the MH370 tragedy, which dissuaded some travellers from visiting the region. Change in visitor arrivals fell from 7% to -3%, whilst the change in supply fell 7% to 4%.
The year 2015 was also remarkable as it witnessed SG50 as well as the oil price collapse. It recorded the lowest RevPAR growth of -5.3% since 2009. Meanwhile, changes in supply (7%) and visitor arrivals (1%) showed some growth.


 Advertise


