Chart of the Day: What tourists spent on in Q2
Visitors from the US splurged more on food.
The Singapore Tourism Board reported:
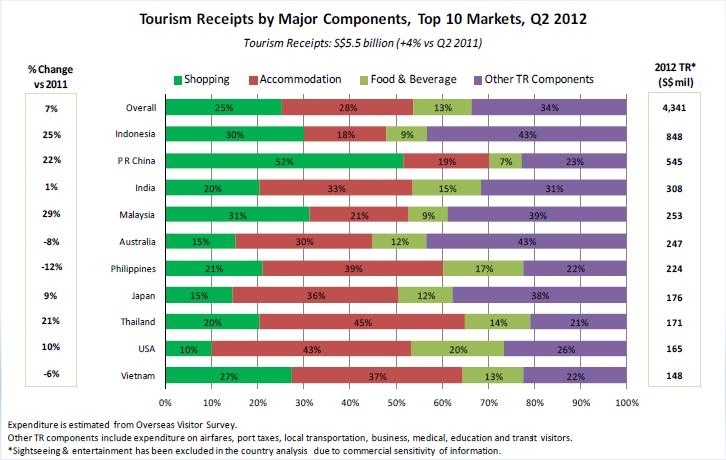
Tourism Receipts or Quarter Two 2012 were estimated at S$5.5 billion, registering a 4% year-on-year growth. All TR components, except Sightseeing & Entertainment, saw year-on-year growth.
Excluding Sightseeing & Entertainment expenditure, Indonesia (S$848 million), P R China (S$545 million), India (S$308 million), Malaysia (S$253 million) and Australia (S$247 million) were Singapore’s top five TR generating markets for Q2 2012.
Malaysia, Indonesia, P R China and Thailand saw the highest percentage change compared to the same quarter last year. TR growth from Malaysia (+29%) was driven by an increase in business traffic and higher shopping expenditure. TR from Thailand (+21%) was boosted by increased spend on Accommodation, Shopping and Food & Beverage, despite visitor arrivals remaining flat.
The Philippines, Australia and Vietnam registered a decline in TR for Q2 2012. TR from the Philippines (-12%) and Australia (-8%) saw a shift in visitor profile (increased VFR traffic from the Philippines and stopover traffic from Australia) and was hampered by lower ground expenditure.


 Advertise


