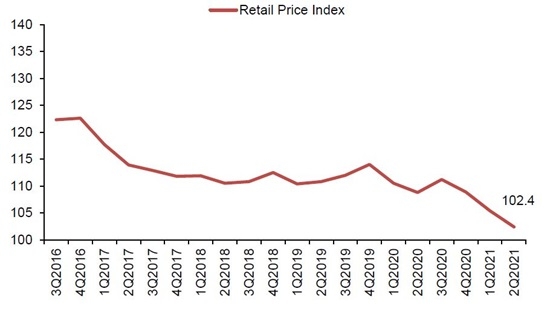
Chart of the day: Central region retail space prices continue to plummet
Retail space prices fall by 2.8% in the second quarter, continuing a trend seen since the third quarter of last year.
This chart from the Urban Redevelopment Authority shows the property price index of retail space in the Central Region since the third quarter of 2016.
The retail space price index fell to 102.4 in the second quarter, a 2.8% decrease from the 105.4 the quarter previous, marking a third-quarter straight of declines.

Rentals of retail space decreased by 0.5% in the second quarter, following the previous quarter’s 4.4% decrease.
As of end-June, there is a total supply of 419,000 sq. m. GFA of retail space projects in the pipeline, compared to the 428,000 sq. m. GFA in the previous quarter.
Occupied retail space increased by 14,000 sq. m. (nett) in the second quarter, which is half of last quarter’s 28,000 sq. m. (nett) increase.
The stock of retail space increased by 18,000 sq. m. (nett) in the second quarter, higher than the 10,000 sq. m. (nett) from last quarter.
Read more here.


 Advertise


