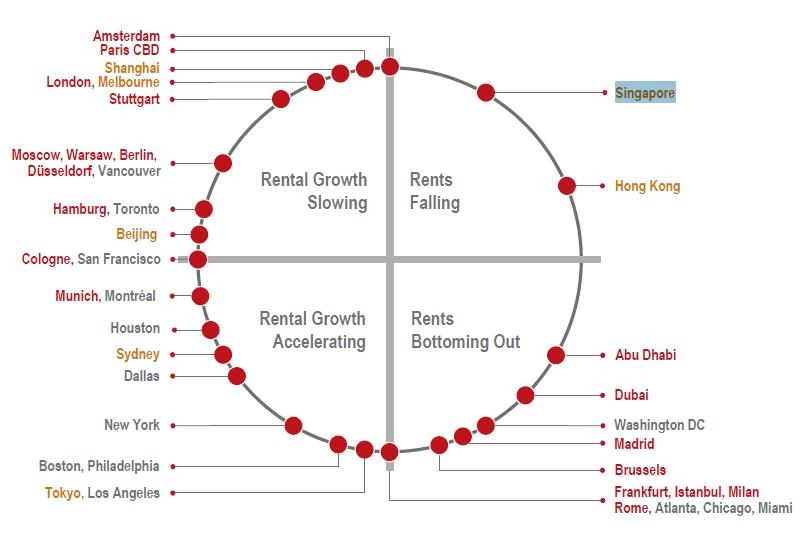
Clock diagram: Here's how Singapore office rents move around the rental cycle
Rents have just fallen in 2Q and it will take long before it bottoms out.
The clock diagram illustrates where Jones Lang LaSalle estimates each prime office market is within its individual rental cycle as at end of the second quarter 2012.
Markets can move around the clock at different speeds and directions. The diagram is a convenient method of comparing the relative position of markets in their rental cycle.
Their position is not necessarily representative of investment or development market prospects. Their position refers to prime face rental values. Markets with a “step pattern” of rental growth do not tend to follow conventional cycles and are likely to move between the “hours” of 9 and 12 o’clock only, with 9 o’clock representing a jump in rental levels following a period of stability.
According to Jones Lang LaSalle, rental rates in Singapore have dropped off modertately since mid-2011 but the decline is slowing.
Due to the completion of a number of new office buildings, this has increased the overall supply and provided more choice to occupiers looking to expand or relocate.
Prime office space in Singapore can now be secured from SGD $9-12 per square feet per month.


 Advertise


